
- Home
- Industries
- Packeged & Premium Water
Digital Transformation for Packaged and Premium Water Producers
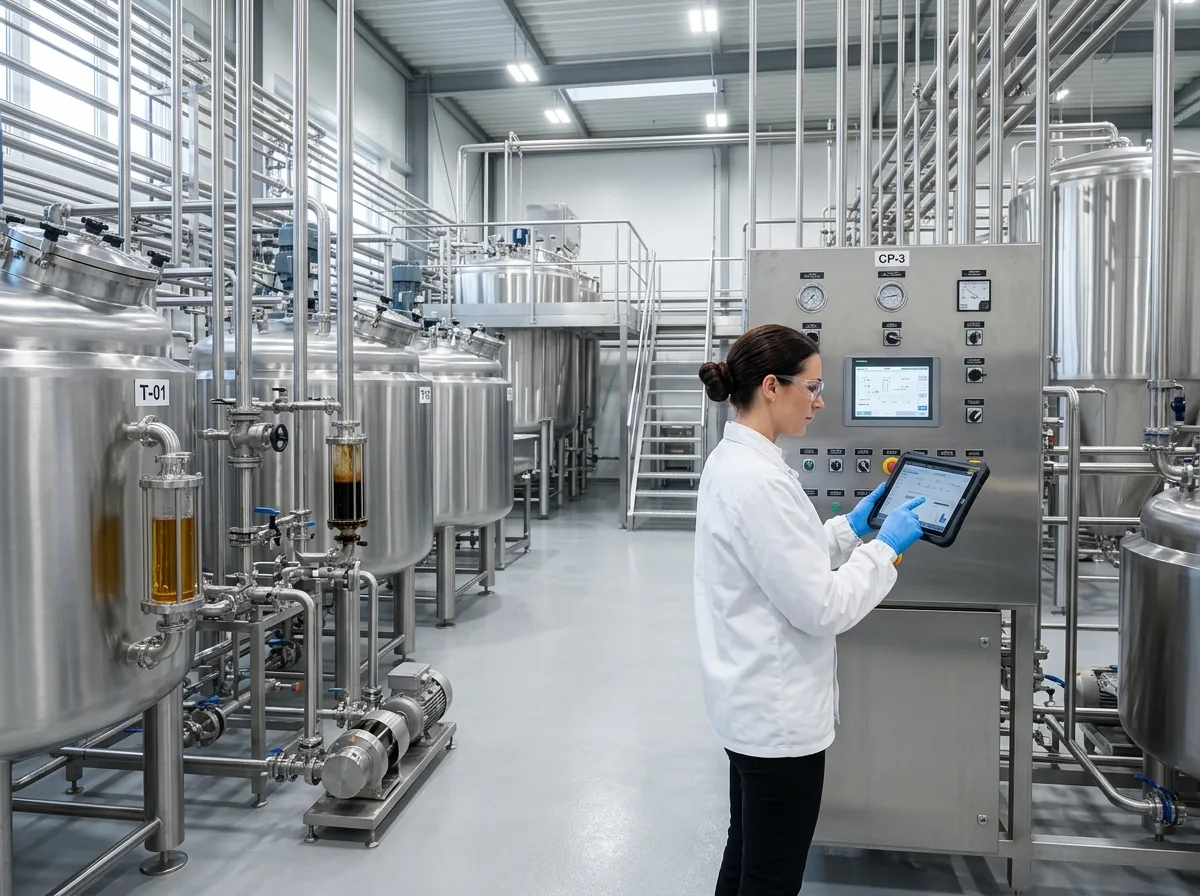
Water is a high-volume, low-margin product where source quality, line efficiency and distribution cost decide profit. Routeget connects source, bottling, quality and logistics data in one operating view.
30+
clients served
$15M+
Savings Delivered
15+ yrs
Serving the Sector
20+
Projects Delivered
Packaged and Premium Water: where the market stands today
A fact base for planning. All figures below are third-party research estimates, not Routeget data, and they differ by how each firm defines the market.
Health-led, premiumising
Consumers continue to move away from sugary drinks toward water, with premium, mineral, alkaline and functional waters gaining share, and sustainable packaging a growing concern.
About US$288 to 326 billion
Grand View Research and IMARC Group value the global packaged water market in a range of roughly US$288 billion to US$326 billion for 2024 to 2025, depending on whether bulk formats are included.
About 5.3% to 6.6% CAGR
Precedence Research and IMARC project growth toward roughly US$500 billion to US$590 billion by the mid-2030s, supported by health awareness and concern over tap-water quality.
Line efficiency and freight drive margin
With little price power, gains come from higher line efficiency, lighter packaging and better delivery routing. Connected plant and logistics data shows where each litre loses money.
Sources: Grand View Research; IMARC Group; Precedence Research; Dataintelo (market drivers). Estimates retrieved October 2026 and subject to each publisher’s definitions; verify against the publisher before citing externally.
End-to-end digital transformation
Strategy, platform selection, integration and data work delivered as one programme.
Food-industry data models
Lot, recipe, yield and co-product structures designed for process manufacturing.
Traceability by design
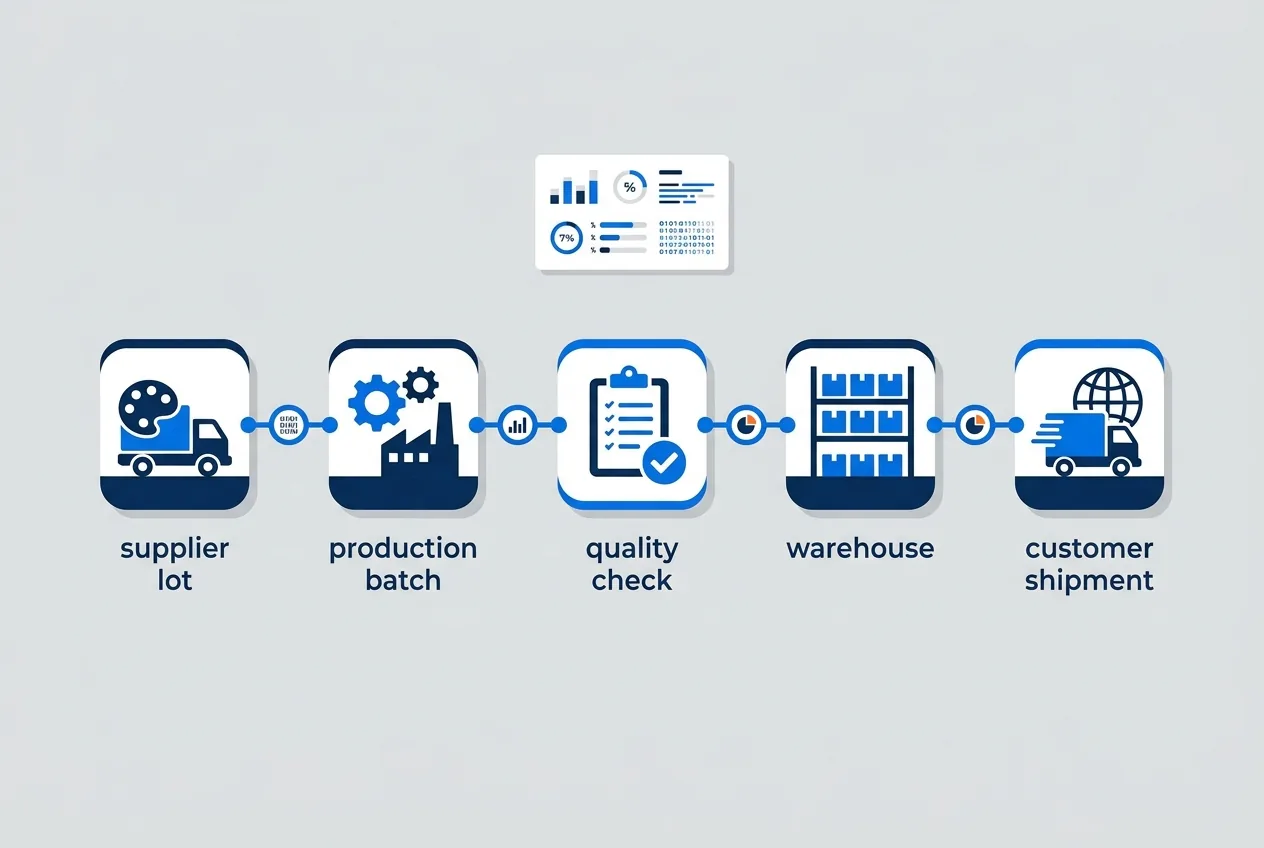
Forward and backward lot genealogy built into inventory and quality workflows.
Plant-floor integration
Connections between production lines, scales, quality systems and the warehouse.
Four pressures that shape packeged & premium water operations
These are the recurring problems we see when sourcing, bottling and distribution operations run on disconnected systems.
Line efficiency losses
Micro-stops, changeovers and filler downtime are noted by hand, so the real cost of lost minutes is rarely linked to a product or shift.
Source and quality compliance
Source monitoring, treatment records and release testing live in separate files, slowing audits and holds.
Freight cost per litre
Heavy, low-value loads make route and load planning decisive, yet delivery cost is seldom visible by customer or SKU.
Packaging and sustainability targets
Recycled content, returnable bottles and deposit schemes add data requirements that spreadsheets struggle to support.
Capabilities built for sourcing, bottling and distribution operations
Pick the area closest to your priority. Each can be delivered on its own or as part of a wider programme.
Link source readings and treatment records to each bottled lot.
- Source and treatment monitoring linked to production lots
- Line schedules by pack format and changeover time
- OEE capture by line, shift and product
- Packaging material usage and recycled content tracking
Release every lot against its evidence.
- Release testing and hold workflows
- Lot genealogy from source to customer
- Audit packs for regulators and retailers
- Corrective-action records tied to lines
Plan and cost delivery for heavy, high-volume loads.
- Route and load planning by customer and vehicle
- Returnable bottle and pallet tracking
- Delivery cost by SKU and customer
- Depot stock and replenishment planning
Understand margin by channel and pack.
- Margin by SKU, channel and customer
- Promotion and rebate management
- Seasonal demand planning
- Premium versus core range profitability
Two scenarios where connected data changes the day-to-day
These are illustrative scenarios that describe the business objective. They are not customer case studies.
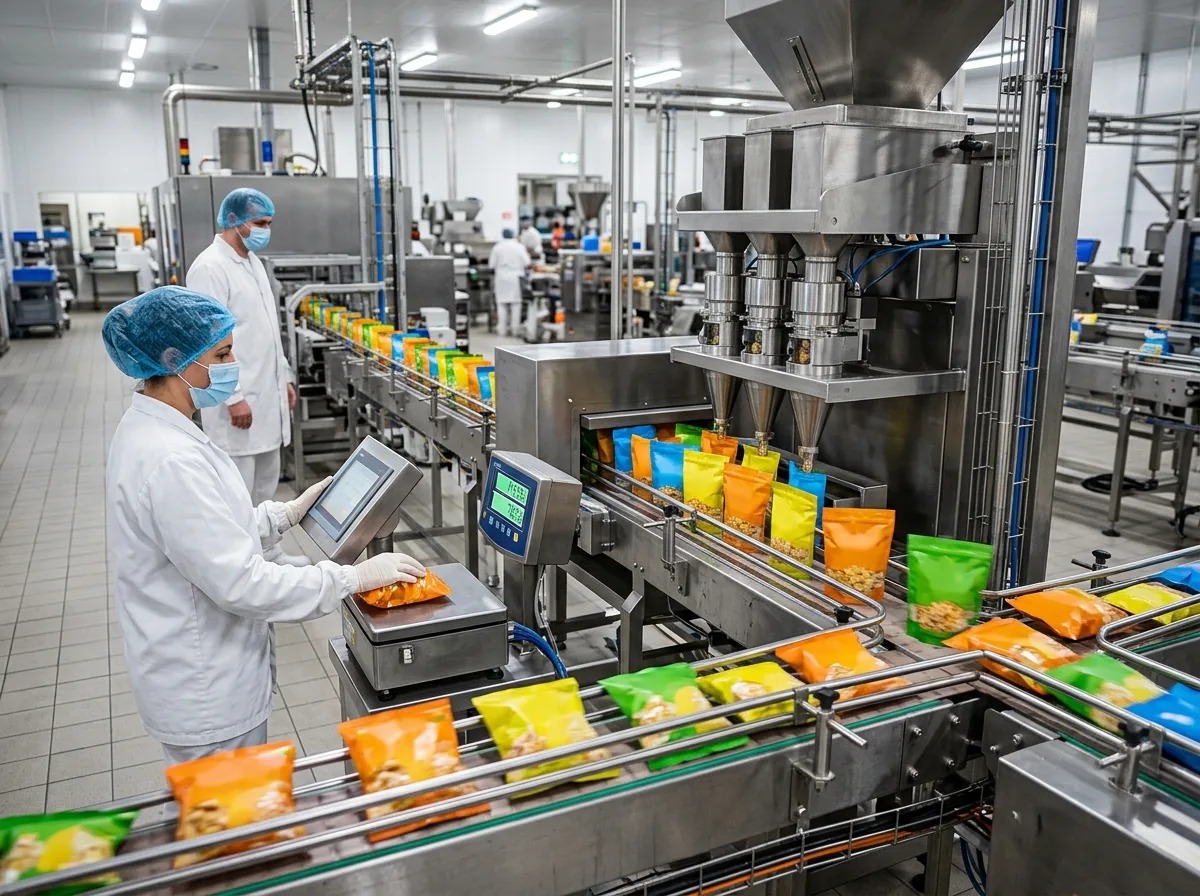
Seeing true cost per litre by line and pack
Line, shift and changeover data are combined with packaging and energy cost to show cost per litre for each product on each line, including the cost of minor stops.
Business objective: focus improvement effort on the lines and packs that lose the most.
Releasing a lot with complete evidence
A customer queries a lot. Quality opens the lot record, sees source readings, treatment and test results, and the delivery list, and answers in minutes.
Business objective: reduce audit effort and respond to complaints with confidence.
How we approach delivery and evidence outcomes
We do not publish unverified customer figures on industry pages. This is how we make outcomes measurable in an engagement.
Baseline first
We agree the starting measures with you before design, such as line efficiency (OEE), cost per litre delivered and quality hold rate.
Delivery in stages
Releases are phased by site and process, so each stage is tested against real operations before the next.
Measured against your targets
Dashboards report the baseline measures from go-live, so benefit is judged on your data.
Examples of Routeget engagements can be discussed in a discovery call, subject to client approval for each reference.
Why Routeget for packeged & premium water
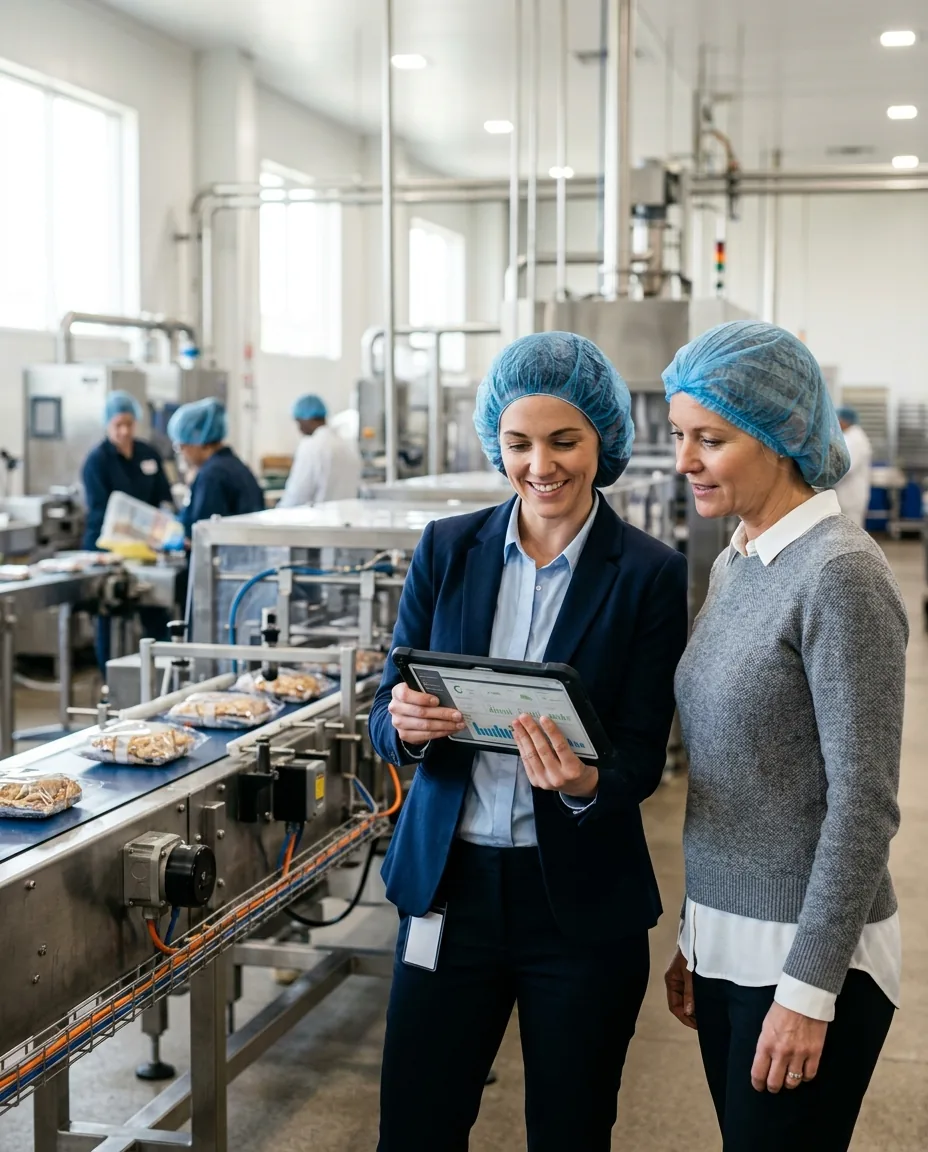
We bring a delivery approach built around the realities of high volumes, thin margins, strict quality standards and heavy, low-value freight.
Volume and logistics economics
We design for the cost drivers of water: line speed, changeovers, packaging material and the freight cost of every litre moved.
Integrated, not stitched together
Source monitoring, bottling lines, laboratory, warehouse, fleet and finance share one data model, so operational and financial records reconcile.
Phased, low-disruption rollout
We plan releases around summer demand peaks and promotional cycles to protect service levels.
Data you can act on
Analytics are designed with your operations team, so measures reflect how your plants actually run.
Related reading from the Routeget team
Perspectives on the supply chain, data and integration topics behind this industry.
Why Automating our Supply Chain is Crucial to your Business Success
Why supply chain automation matters for service levels, cost and resilience.
The Evolving Landscape of Data Modernization Engineering
Trends in data modernization engineering and how they affect enterprise platforms.
AI attracts a new generation while assisting Argentine small producers and winemakers in competing
How AI is helping small producers compete in demanding markets.
Explore adjacent industry practices
Plan your packeged & premium water digital foundation with Routeget
Book a 30-minute discovery to walk through your sources, bottling lines and distribution network and your priorities with a Routeget industry specialist.
Your details are used only to respond to this enquiry. See our Privacy Policy.
Packeged & Premium Water: questions buyers ask us
How do you engage with a packeged & premium water business?
We usually start with a short discovery and a process review of one bottling line with its source, laboratory and dispatch flow. From there we propose a phased scope, which can be fixed-scope for defined releases or a time-and-materials team for ongoing improvement.
Can you integrate with bottling line equipment?
Where lines expose standard interfaces, we collect counts, stops and rejects automatically. Otherwise we design simple operator capture so data starts flowing early.
Does this support returnable and deposit packaging?
Yes. We model returnable containers, pallets and deposit schemes as tracked assets with balances by customer.
Who owns the data and the configuration?
You do. The solution runs in your own environment, and configuration, data models and reports are documented and handed over so your team can maintain them.
How do you approach pricing and timelines?
Pricing and timing follow scope, including the number of plants, pack formats and distribution routes. We share an estimate after discovery, with assumptions and exclusions stated, and we confirm timelines only after reviewing your landscape.